
Cap Rate in Commercial Real Estate: How Property Income Is Priced

Ask two investors what a building is worth and they will often agree on the income it produces long before they agree on its value. The gap between those two numbers is the cap rate in commercial real estate, and it does more work than any other single figure in a transaction. It is not a return you earn, nor a rate a lender sets. It is the price the market places on a pound of property income at a given moment in the cycle.
Most coverage treats the cap rate as a calculation to memorise. That misses the point. The formula takes a sentence. What matters to anyone acquiring, holding or refinancing an asset is what moves the cap rate, what its movement does to value, and why a shift of a single percentage point can reprice a building by millions without a single tenant changing. This post covers that, and the consequence sophisticated owners feel most sharply: cap rate movement is a financing event, not only a valuation one.
For the underlying metric definitions this post builds on, LTV, DSCR, NOI and the cap rate itself, see Real Estate Finance Basics. This post assumes that grounding and goes further.
The Cap Rate Formula, and Why it is Only a Starting Point
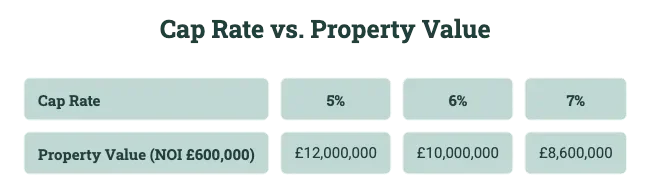
The cap rate in commercial real estate is net operating income divided by current market value or purchase price, expressed as a percentage. A property producing £600,000 of annual NOI, valued at £10 million, carries a 6 per cent cap rate. Reverse the arithmetic and the cap rate becomes a valuation tool: apply a 6 per cent market cap rate to that same £600,000 of income and you arrive back at a £10 million value.
That reversibility is the whole reason the metric matters. NOI is a fact about the building. The cap rate is a judgement about the market. When you value an unlisted asset by applying the cap rate that comparable properties are trading at, you are not measuring the building, you are measuring sentiment toward that type of income, in that location, at that point in the cycle.
Two things follow, and neither is obvious from the formula. First, the cap rate embeds risk: a lower cap rate signals a lower risk, more sought after asset, a higher cap rate signals more perceived risk and, in theory, more return to compensate for it. Second, because value sits in the denominator, cap rates and values move inversely. When cap rates rise, values fall on identical income. That inverse relationship is where the metric stops being a definition and starts driving outcomes.
What Actually Drives The Cap Rate in Commercial Real Estate
A cap rate is not handed down. It is the net result of several forces that shift independently, which is why the same asset can command very different cap rates two years apart.
Interest rates set the floor. A cap rate is an income yield, and it competes with every other yield an investor can buy. When the risk-free rate rises, property income has to yield more to remain attractive, so cap rates tend to widen. When rates fall, capital chases yield into real estate and cap rates compress. The relationship is not mechanical or immediate, but over a cycle it is the dominant driver, which is why commercial property valuations remain cycle-sensitive to monetary policy, a linkage the Bank of England’s financial stability monitoring tracks closely as a systemic exposure.
The risk premium sits on top of the rate. Above the risk-free floor, investors add a premium for illiquidity, for tenant and lease risk, for obsolescence, and for the specific asset’s weaknesses. Two identical rates in the market can still produce different cap rates on two buildings if one carries concentrated tenancy or a short weighted average lease term.
Income growth expectations pull the other way. Where the market expects rents to grow, investors accept a lower going-in cap rate today because they are pricing tomorrow’s higher income. Logistics assets through much of the recent cycle traded at compressed cap rates for exactly this reason. Where income is expected to stall or decline, cap rates widen to compensate.
Liquidity and capital availability matter independently of fundamentals. When debt is plentiful and cheap, more buyers can transact, competition tightens, and cap rates compress. When lending retreats, the buyer pool thins and cap rates widen even if the underlying income has not changed. This is why cap rate movement often leads, rather than follows, visible distress.
Going-In, Exit and Terminal Cap Rates
A single deal usually involves more than one cap rate in commercial real estate, and conflating them is a common and expensive error.
The going-in cap rate is the entry yield: NOI at acquisition divided by the purchase price. It tells you what the income yields on day one, before any business plan takes effect.
The exit or terminal cap rate is the rate you assume will apply when you sell, used to estimate the future sale value from projected stabilised income. It is the single most sensitive assumption in most hold-period models, and the one investors are most tempted to flatter.
Assume you exit at the same cap rate you entered, and the model looks clean. Assume, more prudently, that you exit at a cap rate 50 to 100 basis points higher than entry, reflecting an aged asset or a softer future market, and projected returns can fall sharply on that assumption alone.
The discipline here is straightforward: underwrite the exit cap rate conservatively, above the going-in rate, and stress-test the deal against a further widening. A business plan that only works if you exit at a tighter cap rate than you bought at is a bet on the market, not on the asset.
What Counts as a Good Cap Rate in Commercial Real Estate
There is no universal good cap rate in commercial real estate, and any figure quoted without context is close to meaningless. A good cap rate is the one that correctly prices the risk you are taking, and it varies by property type, location, lease profile and where the cycle sits.
The relative ordering is more useful than any single number. Multifamily and prime logistics typically trade at the lowest cap rates, reflecting durable, granular income and deep buyer demand. Secondary offices, older retail and operationally intensive assets such as hospitality command higher cap rates, compensating for weaker income durability and thinner resale markets. A cap rate that looks attractively high may simply be the market pricing a risk you have not fully identified, which is why a high headline yield warrants more scrutiny, not less.
Because current market cap rates by sector move continually with rates and sentiment, any live benchmark should be taken from a current market source at the time you transact rather than from a static figure in an article. The principle that holds across cycles is the relationship, not the level: know why one asset’s cap rate sits above another’s, and you understand what the market is actually charging you for.
Cap Rate Expansion is a Financing Event
This is the consequence owners feel most and discuss least. A change in cap rates does not only move a valuation on paper. It moves the debt.
Consider an asset bought at £10 million on £600,000 of NOI, financed with £6 million of senior debt at a 60 per cent loan-to-value ratio. Two years later, income is flat or modestly higher, but market cap rates have widened from 6 to 7 per cent. Apply the new rate to the same income and the value falls to roughly £8.6 million. The building has not deteriorated.
Nothing physical has changed. But the £6 million of debt now represents around 70 per cent LTV against the repriced value, and at refinancing, a lender sizing proceeds to that lower value advances less, opening a funding gap the borrower has to close with fresh equity, mezzanine or preferred equity.
That is the mechanism behind a large share of refinancing distress: not falling income, but cap rate expansion quietly eroding the value that existing leverage was struck against. It is why an owner can run a fully occupied, well-performing asset straight into a refinancing shortfall. For how the resulting leverage position is measured and negotiated, see Loan to Value Ratio in 2026, and for how lenders size proceeds against income through a separate floor that is deliberately immune to these cap rate swings, see Debt Yield in Commercial Real Estate.
The practical implication is that cap rate risk should be modelled as a financing risk from the outset. An owner who maps how a plausible cap rate widening would move value, LTV and refinancing proceeds, before drawing the original loan, is positioned to structure around it. An owner who treats the cap rate purely as an acquisition yield discovers the exposure at the worst possible moment, when the maturity arrives in a softer market.
Cap Rate and Yield: What the Metric Does Not Tell You
The cap rate is often described loosely as a yield, and the imprecision causes real confusion. It is an unlevered, all-cash income yield: what the income returns relative to price, assuming no debt and ignoring any change in value. It is not a measure of total return.
It tells you nothing about the effect of leverage, which can amplify both gains and losses against the cash actually invested. It tells you nothing about appreciation or the eventual sale, which flow through the internal rate of return but never touch the cap rate. And it is distinct from debt yield, the lender’s protection metric, which divides NOI by the loan rather than by value and serves an entirely different purpose in underwriting. The cap rate prices the asset for the market. Debt yield sizes the loan for the lender. Reading one as a proxy for the other is a category error.
Used correctly, the cap rate answers one question precisely: is this asset priced in line with the market for its income and its risk. Paired with the return and leverage metrics it deliberately excludes, it becomes the anchor point of a valuation. Read in isolation as a return figure, it misleads.
What to Consider Before You Transact
- Treat the cap rate as a market judgement on your income, not a fixed property of the building.
- Separate going-in from exit cap rates, and underwrite the exit conservatively, above your entry rate.
- Interrogate a high headline cap rate: it usually prices a risk, not a bargain.
- Model a cap rate widening against value, LTV and refinancing proceeds before you draw debt, not after.
- Take current sector cap rates from a live market source at the point of transacting, not from static figures.
- Read the cap rate alongside IRR, leverage and debt yield, never as a standalone return.
Conclusion
The cap rate in commercial real estate is the hinge between income and value, and understanding it as a market-set price rather than a fixed yield changes how an asset is bought, held and financed. Its greatest practical significance is not at acquisition but at refinancing, where cap rate expansion can erode the value that existing leverage depends on while the building itself performs exactly as planned.
Owners who model that exposure in advance protect their position. Those who treat the cap rate as a simple entry yield leave the most consequential variable in their capital structure unmanaged. The metric is straightforward to calculate and easy to underestimate, and the difference between the two is measured in refinancing outcomes.
If you are acquiring or refinancing a commercial real estate asset and want its exposure to cap rate movement modelled properly before you commit to a structure, we welcome a discreet conversation. Contact us today.
For a structured breakdown of how these strategies are applied in practice, see the Commercial Real Estate Playbook.